AI (Generic)
The AI (Generic) widget lets you generate a custom visualization by describing what you want in plain language instead of building it manually. You give the widget an initial set of instructions, optionally point it at the data it should use, and it renders the result directly on the dashboard. Use it when you need a chart or layout that the standard widget types do not cover, or when you want to prototype a view quickly.
Adding the widget
- Navigate to a Una portal.
- Log in using valid credentials.
- Click Explorer in the top-left menu.
- Expand the folders until you reach your target dashboard.
- Open or create a dashboard.
- Click + Add Widget to begin.
- Select AI (Generic) from the widget list.
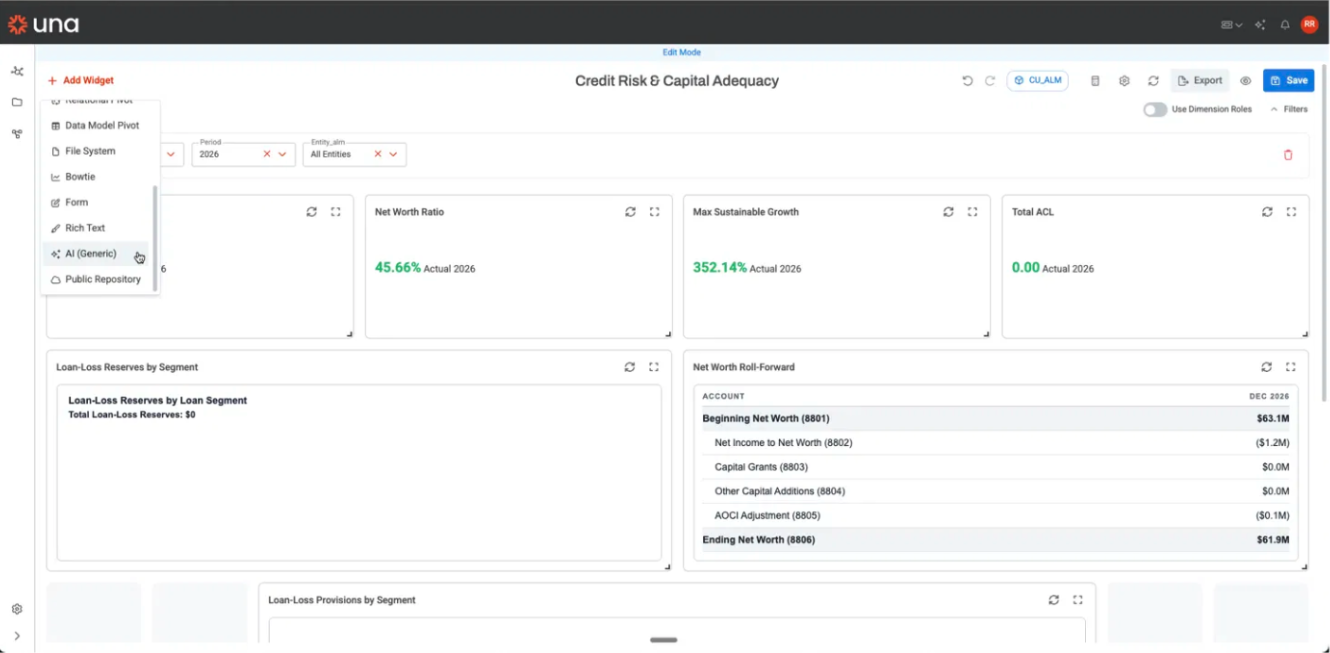
- A widget titled New Ai Widget is added to the dashboard.
- Right-click the top of the widget to open the context menu, then click Edit. The Settings panel opens on the right.
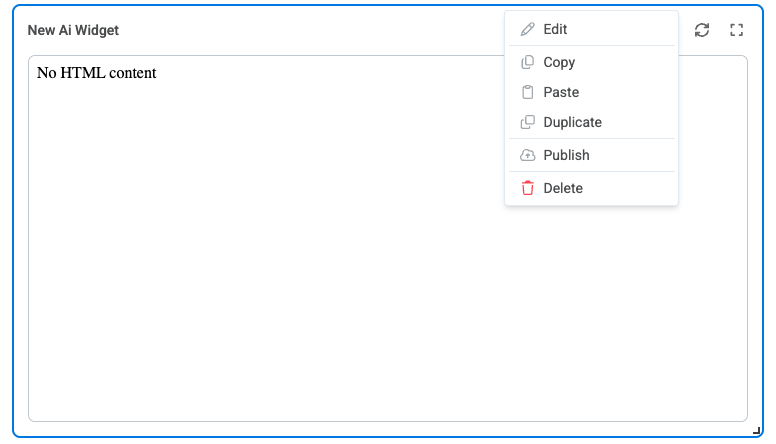
Configuring the widget
With the Settings panel open, the General section contains the fields you use to build and refine the widget.
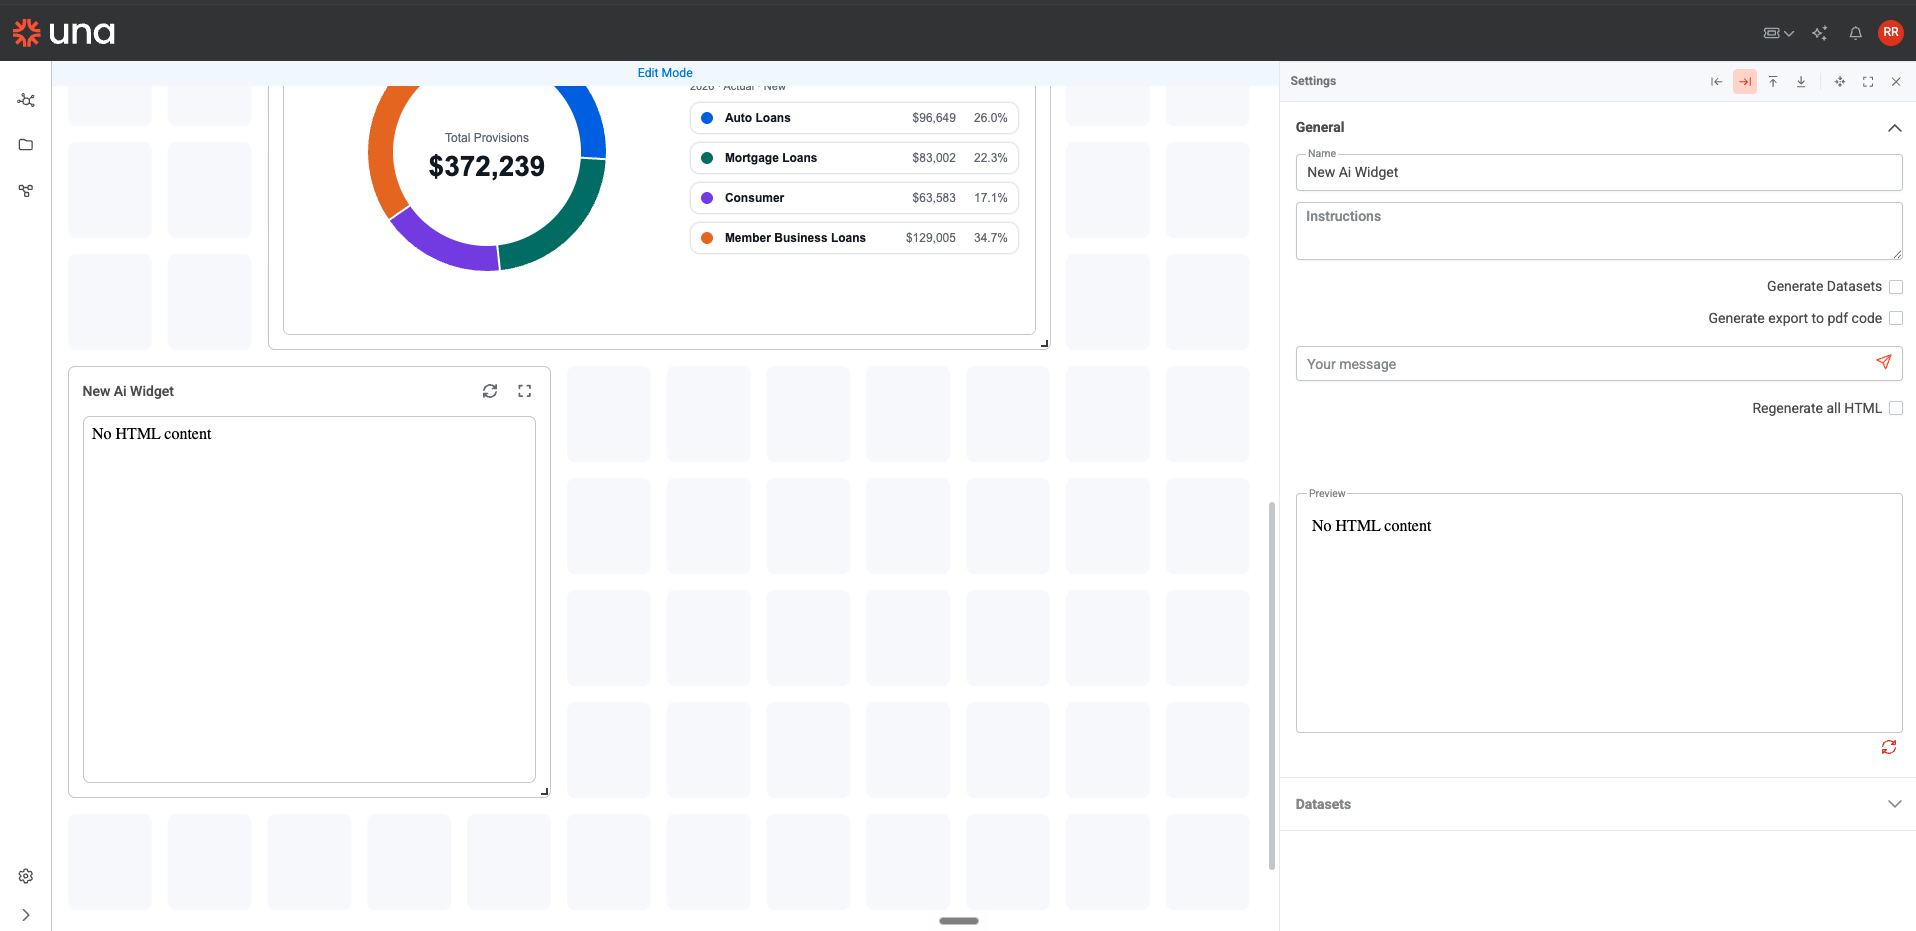
Name
Enter a name for the widget in the Name field. This is the title shown on the dashboard.
Instructions
The Instructions box holds your first prompt — the initial description of what you want the widget to build. Write it here when you first set up the widget.
After the widget has generated its first output, you do not keep editing the Instructions box to make changes. Use the Your message box for that (see below).
Be explicit about the structure of your data in the Instructions prompt, and describe the output you want clearly. Avoid hardcoding specific year values so the widget continues to work as periods change.
Your message
Once the widget exists, every follow-up change goes in the Your message box. Type your adjustment, then click the send arrow. Each message is a new instruction to modify the current widget.

Make one change per message. If you ask for several changes at once, the widget can lose its existing styling when it regenerates. Send each adjustment as a separate message and confirm the result before sending the next one.
Choosing the data
The widget needs to know what data to pull. You have two approaches, shown in the table below.
| Option | What it does | When to use |
|---|---|---|
| Datasets section | You build your own model query and choose exactly which dimensions to pull in. | Use when you know the specific dimensions and members you want and need precise control over the query. |
| Generate Datasets checkbox | The AI decides which dimensions it needs and pulls them in for you. | Use when you want the widget to figure out the required data on its own, or when prototyping quickly. |
To build the query yourself, expand the Datasets section at the bottom of the Settings panel and define your query there. To let the AI choose, tick the Generate Datasets checkbox.
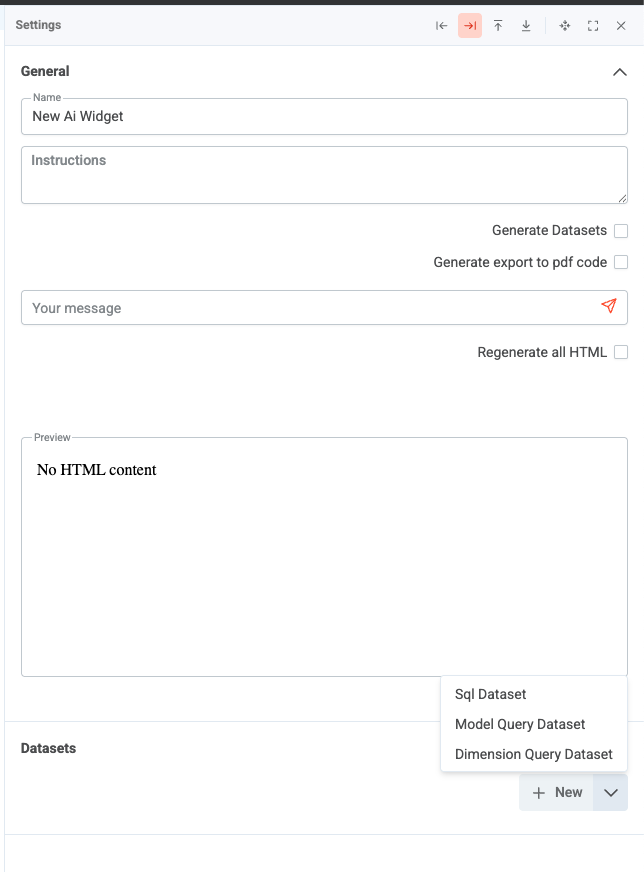
Preview
The Preview pane in the Settings panel shows the rendered output as the widget generates it. Until the widget has produced output, it displays No HTML content. The same content appears in the widget on the dashboard.
Saving
When the widget looks correct, click Save at the top of the dashboard to persist it.
If you reference account or member names in your prompt, match the exact name as it appears in the model, including spacing and punctuation. A mismatch (for example, "and" versus "&") can cause the widget to miss the data you intended.
Start to Finish Walkthrough
- Navigate to your dashboard and click + Add Widget.
- Select AI (Generic). A widget titled New Ai Widget is added to the dashboard.
- Right-click the top of the widget and click Edit to open the Settings panel.
- In the Name field, enter a descriptive name for the widget.
- In the Instructions box, write your first prompt describing the visualization you want, including the structure of the data it should use.
- Decide how to supply the data: expand the Datasets section to build the query yourself, or tick Generate Datasets to let the AI choose the dimensions.
- Review the Preview pane to confirm the output looks correct.
- To refine the widget, type a single change in the Your message box and click the send arrow. Confirm the result, then repeat for any further changes.
- Click Save to persist the widget on the dashboard.